Extended Insights into Healthcare Workforce Migration
Purpose of the visualizations in the website
Healthcare systems worldwide face numerous challenges, including the migration of healthcare professionals and financial investments in health services. Understanding these dynamics is crucial for policymakers, healthcare providers, and researchers. Our visualization combines data on the inflow of foreign-trained doctors and GDP spending on health, offering insights into the health policies and practices of OECD countries:
- Inform Policy Development: The visualization helps policymakers identify trends in healthcare worker migration and spending, aiding in the development of policies that balance domestic workforce retention with the attraction of international talent.
- Career Insight for Healthcare Professionals: The visualization aims to provide healthcare workers with clear data on global healthcare investment and demand, supporting informed decisions about potential career moves and opportunities abroad.
Features of the Visualization Tool
The features in the visualizations provided in this website would are equipped with features that will help viewers to gain better insights into the data:
- Interactive Chloropleth Maps and Bar Graph:Enable users to delve into specific country data, offering a detailed view of both the inflow of foreign trained doctors into OECD countries, highlighting migration patterns and trends over time
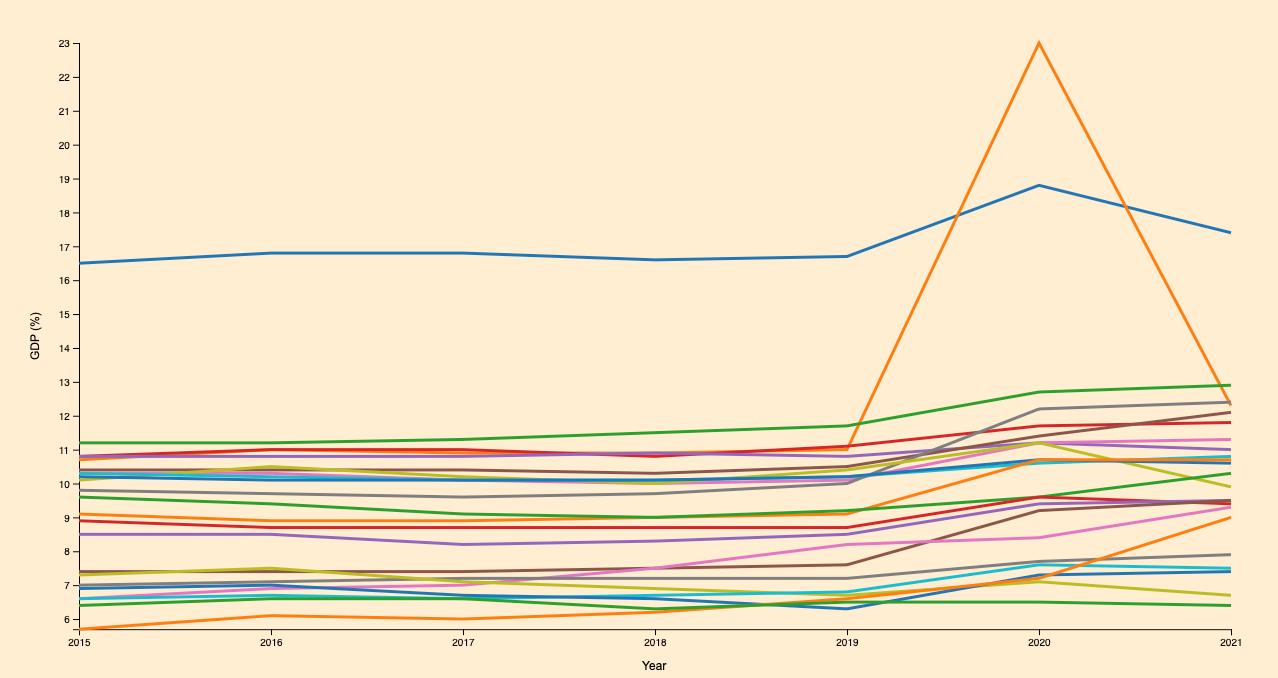
- Line Chart: Enable users to track and analyze the historical trends in healthcare spending as a percentage of GDP, highlighting how different countries prioritize healthcare over the years
Benefits of the Visualization Tool
This visualization tool would offer several benefits to healthcare students and professionals planning their careers:
- Informed Decision Making: Access to comprehensive, up-to-date data aids in making informed decisions about where to pursue career opportunities.
- Strategic Planning: Understanding global trends helps in planning long-term career paths and professional development.
- Networking Opportunities: Identifying regions with a high influx of professionals can highlight networking and collaboration opportunities.